Most charts have the following dynamically generated layers.
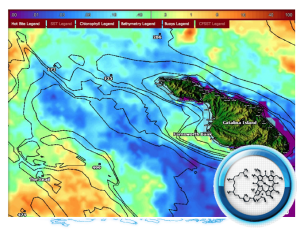
Sea Surface Temperature (SST)
Temperature breaks create “edges” in ocean currents that that congregate bait, kelp paddies and sea life. Find the break, find the fish.
Because we receive live-feeds from multiple satellite receiving stations we are able to make SST images available to our user’s right after they’re collected. Since we process all of our own data, we are able to make our images available at the highest resolution possible. SST measurement can only be made in clear sky conditions. We use our own cloud masking routines to ensure that we only show the highest quality data and make use of all of the clear pixels.
When experiencing cloud cover the next best thing is our Cloud Free SST’s
“Cloud Free” Sea Surface Temperature
Using the latest satellite technology, we can now see the ocean surface temperature THROUGH the clouds. Our Cloud Free SST maps put you in the zone even when the weather isn’t cooperating. Cloud-free SST images are produced daily and can be very helpful to locate water warm enough to hold pelagic fish even during periods of overcast and poor weather.
When there is no cloud cover our regular Sea Surface Temperature charts provide the most accurate information.
Chlorophyll Concentration
Surface chlorophyll concentration (CHL) is a measurement of the quantity of plant life in the surface layer of the ocean. CHL observations give us information about how clear the water is at a particular location and where different water masses come into contact with each other.
With a Chlorophyll break comes bait fish, with the bait comes the offshore predators. Use our Chlorophyll charts to verify the water you want to fish is clean and blue. Don’t waste time and fuel running to dead green water.
Since CHL can only be measured during daylight hours we produce a daily CHL map that combines all the CHL shots of the day into a single image. Because life in the ocean tends to accumulate in patches, we enhance our CHL images to show where abrupt changes in chlorophyll concentration occur helping you find the areas that hold fish.
A Chlorophyll chart combined with a Sea Surface Temperature Chart are the tools tournament and commercial fishermen live by.
Hot Bite Locations
We gather daily fish reports from professional captains, sport boats, 6 pack and 4 pack charter boats, fly over planes, commercial fishermen, VHF and private anglers like yourself.
We take the info from our written daily fish report and display it on our charts with a color coded fish icon showing where the fish were caught and when. This results in one of the most accurate fish trends available.
Point your boat towards the leading edge of the fish trend mixed with the current SST, Bite Zone and Chlorophyll charts and wait for the jigs to go off.
Catch More Fish. Burn Less Fuel. Only $199 per year!