
Fishdope’s high definition bathymetry maps are a game-changer for inshore and island fishing in Southern California.

Fishdope is proud to introduce high definition bathymetry maps as a new feature for 2024, included at no extra cost with your regular Fishdope membership. Our HD bathymetry maps cover Catalina Island, Santa Barbara Island, San Nicolas Island, and San Clemente Island, with more island and inshore areas coming soon.
These bathy maps show reefs, dropoffs, rock piles, wrecks, and other important bottom structure in stunning high-def detail to make it easy to find the best spots to catch rockfish, calico bass, sand bass, halibut, lingcod, and more.

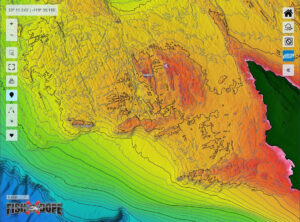
Smoother-looking areas show sandy flats and pavement-style flat hardbottom. Species like halibut, sand bass, and whitefish will hang out along the edges of these sandy flats and hardbottom areas where they jut up against higher-relief structure. You’ll also find barracuda, yellowtail, and white seabass cruising open water along these edges and up-current from the structure, picking off bait balls of sardines, mackerel, and anchovy that stray too far out away from the reefs and kelp beds.
Broad sandy flats in 60-120 ft of water (orange to yellow colors on the high-def maps) are also where squid gather up to spawn around the full moon – and of course, white seabass, yellowtail, and halibut aren’t far behind!
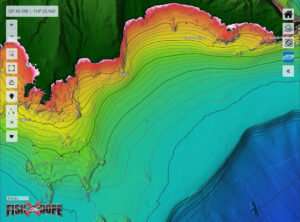
We provide a custom-colored base map with shaded relief to make it easy to see shallow high spots and dropoffs to deeper water. White and pink areas are very shallow, less than 2 fathoms (12 ft) deep, and red is less than 10 fathoms (60 ft) – use caution in these areas! The colors gradually change as you move deeper, with orange centered around 10 fathoms (60 ft), yellow centered around 20 fathoms (120 ft), green around 30 fathoms (180 ft), and transitioning to pale blue out through 50-100 fathoms. Deeper waters are shown in progressively darker blue to purple colors.

Our high-def maps also show contour lines marking depth curves every 2 fathoms (12 ft) for shallow and inshore areas out to 50 fathoms (300 ft) deep. These contour lines help show areas that drop off rapidly (contour lines close together) vs. more gradual slopes (contour lines farther apart). The lines marking every 10 fathoms are darker to make it easier to find depth at a glance.
-

- Farnsworth Bank

-
- Pyramid Cove

-
- San Nicolas Island

-
- Santa Barbara Island

Data courtesy of Seafloor Mapping Lab at California State University, Monterey Bay; U.S. Geological Survey; NOAA National Centers for Environmental Information; and GEBCO Compilation group (2024). Not to be used for navigation.