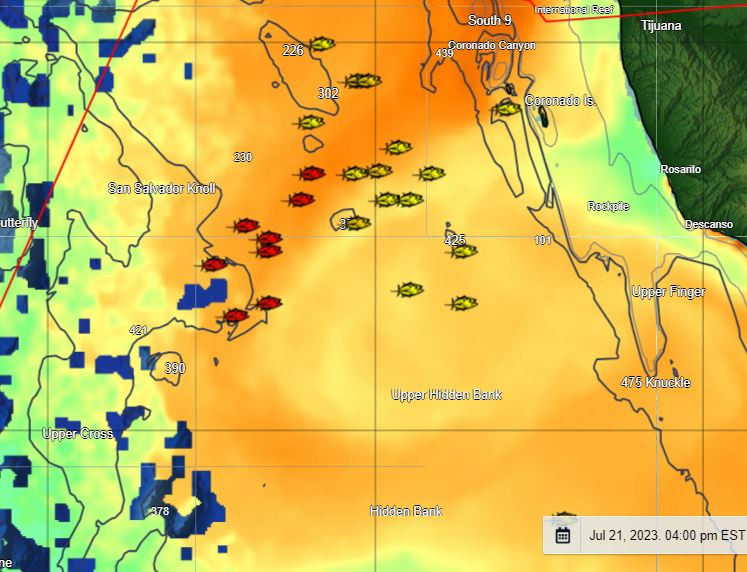
Sea surface temperature (SST) maps show where conditions are right for pelagic gamefish like tuna, dorado, yellowtail, and marlin.
We process sea surface temperature data from multiple satellites and update our charts as soon as possible to give you the latest offshore fishing maps available. We process the data into the highest resolution possible to make temp breaks easy to find. We have numerous sources for our SST data so that if one of our receiving stations goes off line for whatever reason we are able to utilize any of our other sources to ensure that we can make the highest quality SST images available to you every day.
Temperature breaks create “edges” in ocean currents that congregate bait, kelp paddies and sea life. Find the break, find the fish.
SST measurement can only be made in clear sky conditions. We use our own cloud masking routines to ensure that we only show the highest quality data and make use of all of the clear pixels. Because of the number of SST shots we can offer in a single day we make sure to pick the finest so that you don’t have to waste your time navigating though a bunch of images in order to find the best shot.
When experiencing cloud cover the next best thing is our Cloud Free SSTs
Data courtesy of NASA PO.DAAC, GHRSST, & NOAA Coastwatch. Not to be used for navigation.
Catch More Fish. Burn Less Fuel. Only $199 per year!